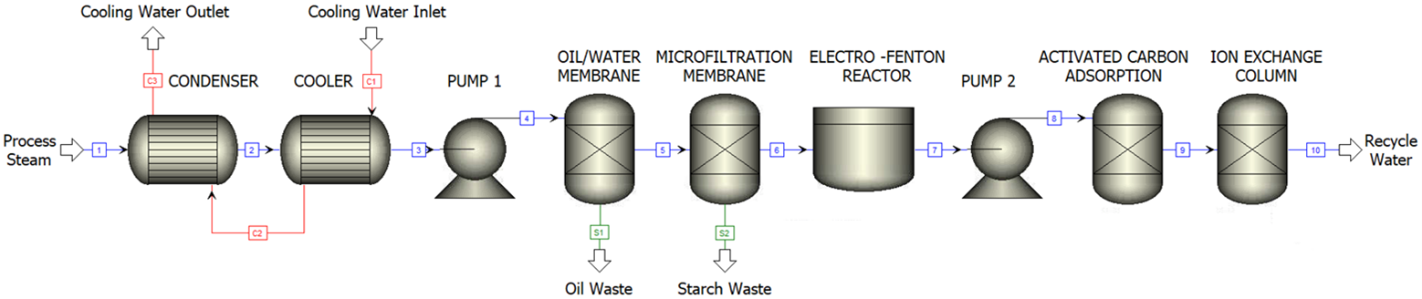
Process flow diagram for capture and condensation of steam evolved from potato chip fryers to be cleaned and reused as wash water elsewhere in the chip manufacturing process.
Introduction
PepsiCo engineers estimate that the average American consumes over four pounds of potato chips yearly, adding up to over a billion pounds of chips eaten per year in the U.S. alone, according to the Northern Plains Potato Growers Association. The production of potato chips provides an opportunity for sustainability improvements and operating cost reduction as potatoes are 80% water by weight and a majority of this water is driven off by the chip frying process. This water can then be captured and processed for reuse elsewhere in the plant. To address this issue, US Patent 10519050B2 proposes a description of a process to recover evolved fryer steam, but capital costs for implementing the design are too high for most regions of the world where potable water is relatively inexpensive, according to PepsiCo engineers.
A new process is proposed, processing a feed basis of 20,000 lb/hr of potatoes with the plant operating continuously: 24 hours per day, 5 days per week, and 50 weeks per year, for a total of 6,000 hours per year. Expensive and/or unnecessary units from the patent were replaced with more cost-effective and/or efficient alternatives while maintaining inlet and outlet specifications for the process.
After the washing, slicing, and cooking of the potatoes, the steam evolved from the fryers is isolated for water recovery and water treatment. The feed water is contaminated with suspended droplets of oil, dissolved starches, acrylamide, phenols, and ammonia. The process steam is first sent through a condenser and heat exchanger to cool to a 45°C stream of liquid water. The excess oil is separated from the aqueous phase via a super-wettable membrane. The stream is passed through a microfiltration to remove any remaining suspended solids as well as the starches. An Electro-Fenton (EF) reactor degrades acrylamide and phenols to more oxidized compounds removed by a granulated activate carbon (GAC) absorption bed. Finally, ammonia is removed in an ion exchange column. Upon exit of the system, the effluent wastewater will meet the standards as seen in Appendix B and can be used elsewhere in the process.
Process Description
Condensation and Heat Exhange
The first step in this water purification process is condensing vapor from the fryer stack and cooling it down to operation conditions. To accomplish this cooling, a condenser and a cooler are used in succession. 8,100 kg/hr of steam enters the condenser at 130 °C and atmospheric pressure, where it is cooled to saturated water at 100°C. The cooling and condensing occur in the same shell because the area required for cooling, 1 m2, is miniscule compared to the area for condensing,100 m2. The stream then enters the cooler, where it is further cooled to 45°C.
To accomplish process stream cooling, 89,000 kg/hr of cooling water available at 32 °C is used. The cooling water first enters the cooler in countercurrent flow, where it exchanges 520 kW of energy, and is heated to 37°C. Subsequently, the cooling water stream enters the condenser in countercurrent flow, where 5300 kW are extracted from the process steam. The cooling water is heated to 87°C and returned to allocation facility.
Oil/Water Membrane Separation
Upon condensation and cooling, the process stream is pumped to a series of membrane separations. A 27 kW pump increases the pressure of the process stream from 101 kPa to 209 kPa in order to overcome the pressure drop across both membranes. In the first membrane, oil is separated from the stream using a super-wettable membrane made of copper mesh coated with TiO2 placed in-line and operated continuously. The membrane leverages the different affinities of oil and water towards a material, ultimately leading to a superhydrophilic and superoleophobic surface. Membranes of this type have been found to successfully and efficiently separate oil in water, even when oil is emulsified.
A super-wettable membrane was chosen over other oil/water separation techniques for a variety of reasons. This separation method, while still largely experimental, achieves high efficiencies of separation and can be placed in-line and operated continuously. With a limited area of 300m2, floor space is incredibly valuable and units that can minimize total usage are highly valuable. Gravity separation units would require significantly larger areas of floor space, whereas super-wettable membranes require minimal surface area. Additionally, the unit is effective at removing oil from water even when emulsified, which provides a significant advantage over filtration units that operate based on particle size, such as flotation and adsorption devices. This method also does not require any settling time, advantageous in minimizing cycle times, unlike gravitational separation. Additionally, as the main objective of this study is to reduce wastewater in order to be more environmentally friendly, this unit will not produce significant amounts of secondary pollution or chemical waste, whereas chemical separations would likely produce significant amounts of byproducts.3 This method is also expected to be advantageous in regard to cost, as it can be placed in line and does not require significant capital costs.
The process stream flows at 8,100 kg/hr and contains 50 mg/L of oil and grease from the fryer, modeled as oleic acid. The oil exists as a suspended solid with a particle size of 10 micrometers per droplet. On the specified TiO2 coated surface, oleic acid has a contact angle of 163o leading to a Cassie-Baxter state in which the membrane operates as a superhydrophilic and superhydrophobic material, allowing for the passage of water and the beading of oil on the surface.4 This ultimately allows for 98.5% of the oil to be removed from the process stream, the equivalent of 4.03 kg/hr, leaving 0.06 kg/hr in the stream.5 The separated oil will leave the system as a waste stream, while the water with the small amount of remaining oil and the rest of the contaminants will continue on to an ultrafiltration unit. As the operation is continuous, it will be assumed that 5% of the water will be lost with oil filtration and the membrane operates with a 95% permeate to feed ratio.
As much of this research is still in the academic and experimental phase, it will be necessary to start with a trial at a pilot plant. Additionally, not all membranes of this type are readily sized and available. A similar membrane with stainless steel mesh and other coatings were capable of processing a total flux of 5152 L/m2h.29 Assuming the required membrane area for a given flux across different super-wettable materials is not significantly different, the required membrane area for effective separation with the level of flux required for this process is 1.59 m2 as calculated in Appendix G, and experimental data shows the optimal operating pressure to be just above atmospheric pressure, at 8 kPa above.30 As this is still academic research, a larger membrane could be used to ensure a high degree of separation.
The ultimate goal of separating the oil from the water is to reduce the overall turbidity of the effluent. As turbidity is linearly related to the concentration of suspended solids in the oil and the only suspended solids are assumed to be oil and grease, a 98.5% reduction in the presence of these compounds can be assumed to correlate a similar reduction in the turbidity levels.7 The unit will require a pilot plant in order to trial the membrane in an industrial setting. In order to completely remove the oil and grease, the process stream will also undergo ultrafiltration in the next purification step.
Microfiltration
Once suspended solids and oils are mostly removed, the process stream is passed through a microfiltration unit to remove dissolved potato starch molecules. These high molecular weight carbohydrates contribute to most of the chemical oxygen demand (COD) in the stream. The starch molecules are assumed to have a molecular weight of 10,000 g/mol and have a spherical random coil shape with an approximate diameter of 2μm. The microfiltration membrane is made of polysulfone, with a pore size of 100 nm, allowing to remove both the remaining oil and the starch.
The microfiltration process was included in this process to reduce the demand on the Electro-Fenton reactor. One of PepsiCo’s main concerns regarding the process described in US Patent 10519050B2 is the high cost associated to sludge disposal in the Fenton reactor, and the concentration of starch is 150 times higher than any of the other components treated by the Fenton reaction. Even though the Electro-Fenton unit, as described below, produces far less sludge than the traditional Fenton reactor, placing the microfiltration unit before the Electro-Fenton reactor will remove 85% of organic molecules that would otherwise overload the Fenton reactor, thereby producing less sludge. Polysulfone was chosen as the membrane material because it is commonly used in industry for microfiltration and is widely available in the market. A pore diameter of 100 nm was chosen because it allows for larger flux of water while still being 10 times smaller than the average starch molecule diameter. Additionally, the unit removes excess oil that may not have been separated previously through the oil-water membrane, with oil droplets assumed to be 10 μm in diameter, ultimately removing any remaining turbidity in the stream.9
7695 kg/hr of water enter the microfiltration setup at a pressure of 209 kPa. The pressure gradient between permeate and retentate sides is 100 kPa, and this driving force is created by Pump 1 before the Oil/Water Membrane. Water passes through the microfiltration membrane with a flux of 149 kg/m2h, with a membrane area of 49 m2. The purified water exits the unit at a flow rate of 7,310 kg/hr, corresponding to a permeate-to-feed ratio of 95%.8 Calculations can be seen in Appendix F.
Electro-Fenton Reaction
After the starches are removed from the process stream by the ultrafiltration unit, the stream is sent to an Electro-Fenton (EF) reactor to degrade the remaining organics. PepsiCo’s largest concern with using a Fenton reactor in the process is the high operating costs for disposing of the iron-rich sludge formed as a byproduct. To address this, the Fenton process was compared to processes with similar oxidative power such as Electro-Fenton (EF), Photoelectro-Fenton, ozonation, and acid hydrolysis. Ozonation and acid hydrolysis do not generate an iron-rich sludge; however, they rely on reactive chemistries with a lower oxidative potential and therefore cannot degrade organics as quickly as the Fenton-like processes.10,11
Instead of changing the chemistry, other means can reduce the volume of sludge. The EF process was chosen because its electrochemical regeneration of catalyst and in situ generation of hydrogen peroxide greatly reduces the amount of iron catalyst required compared to the traditional Fenton process.2 Additionally, it leaves the reactor in its more soluble oxidation state. This catalyst reduction, in conjunction with an ultrafiltration unit to filter out the starches beforehand, reduces the total mass of organics entering the EF reactor by 99%, thus greatly reducing the amount of sludge produced.
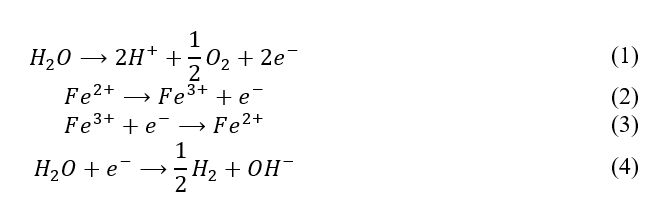
The EF reactor operates differently from a typical Fenton reactor because it uses electrolysis to generate hydrogen peroxide in situ. This is much safer because it obviates peroxide transportation and storage risks. A simplified set of the electrode half reactions (1-4) are:
The products of reaction 1 may react, in different stoichiometry, to form hydrogen peroxide according to equation 5.

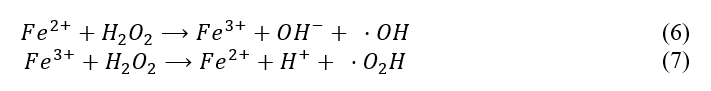
This hydrogen peroxide will react with ferric ions to form hydroxyl radicals via a complex mechanism. Because the exact kinetics are not known, a simplified set of reactions (6 and 7) were used.
The hydroxyl radicals will break apart organic molecules into intermediates, and those intermediates eventually into carbon dioxide, water, and ammonia if the reaction goes to completion.

Countless intermediates could come from any given input due to the complexity of the radical mechanisms. As such, ‘primary’ intermediates were chosen for each compound based on a study of their oxidative radical chemistry. For acrylamide, model intermediates of acrylic acid, propionic acid, and acetic acid were chosen. For caffeic acid (the main phenol compound present in the water at a concentration of approx. 0.05mg/L): o-benzoquinone, hexadienedioic acid, and acrylic acid were chosen. All relevant reaction equations are provided in Appendix D, where only the major reactants and products are shown.
Because hydroxyl radicals and ferric ions are constantly being generated and recycled, the system behaves according to pseudo first-order kinetics. An in-depth kinetic analysis by Oturan and Oturan measured the apparent rate constant (k_app) of various organic compounds in an EF reactor, determined absolute second-order rate constants where k_app=[⋅OH] k_2, and found that the rate constant was consistently of the order of magnitude k_2 = 109 M-1s-1 across different types of pollutants.12 Because all of the pollutants tested had very similar rate constants, it is assumed that all pollutants will react with the same rate constant. None of the reactions are competing for reactants or have significant reverse reaction rates, and so this assumption should not have a large effect on the modeled output.
All of the compounds tested in the paper contained chlorine. It should be expected that chlorine-containing compounds are more reactive since chlorine ions and hydrochloric acid are stable leaving groups. Thus, Oturan’s kinetic model was used with a rate constant of k_2 = 1.5 x 10⁸ M-1s-1, an order of magnitude lower, to account for the lower reactivity of non-chlorine-containing organics. This adjustment made the model predictions fit closely with the chemical oxygen demand (COD) reduction of other papers on the subject.
A kinetic analysis by Maezono et. al., indirectly measured the hydroxyl radical concentration through spectrophotometric measurements of dye degradation in a photoelectron-Fenton reactor. Hydroxyl radicals are generally considered a ‘non-observable’ due to their nanosecond-scale lifespan; however, their analysis was used to inform an order-of-magnitude approximation of [⋅OH]= 1 x 10⁻⁸ M.
Together, these parameters k_2 and [⋅OH] were used with the rate equations E1-E9 written in Appendix E to solve for concentrations as a function of time in a batch reactor. This system of partial differential equations was solved in MATLAB using numerical derivatives with a step size dt=0.1s. The solution converged to steady values which did not change with smaller step sizes. Concentration profiles of all species over time are displayed in Figures 2 and 3.
Abbreviation Key: Am: acrylamide; AcrylA: acrylic acid; PA: propionic acid; AcetA: acetic acid; CA: caffeic acid; BQ: o-benzoquinone; HA: hexadienedioic acid
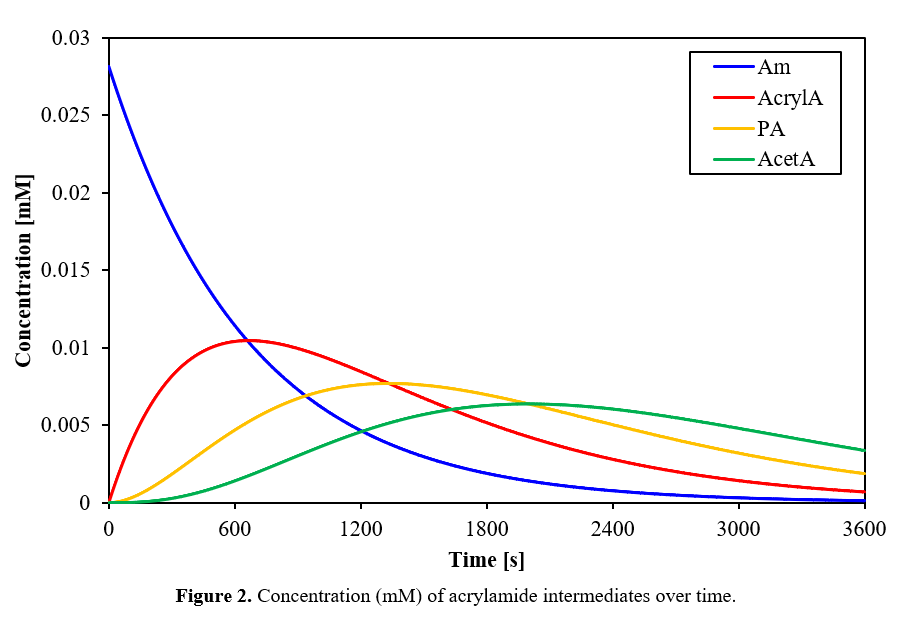
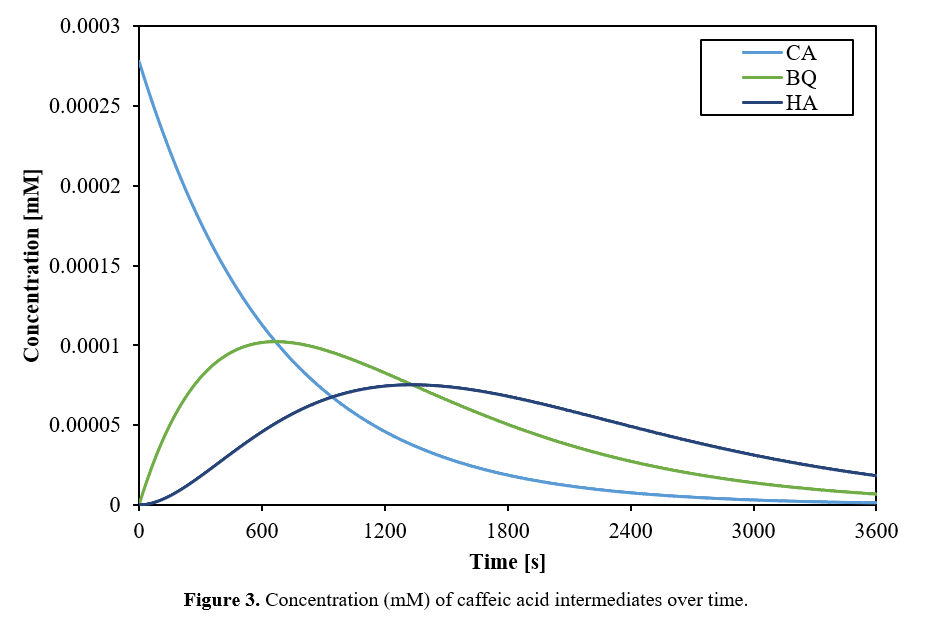
The modeled reaction profile in the graphs above shows a 78% COD reduction after 1 hour, which is consistent with other literature ranging from 60 to over 95%.
A CSTR design was considered, but the increase in necessary residence time and total volume of the reactor necessitated such an increase in electrode area and power draw that it was cheaper to use two batch reactors instead and alternate their duty cycles. These batch reactors each operate ‘on’ one hour, ‘off’ one hour for a 2-hour cycle, with a valve to switch between them to handle the continuous flow of the rest of the process. As mentioned previously, the reactor produces little to no sludge, and whatever sludge does form will be removed by the following units.
According to literature, the EF reactor operates optimally at pH = 3 with approx. 2 mg/L Fe2+ catalyst and electrode spacing of 2 – 5 cm. Electricity consumption varies from 15 kWh/m3 to 45 kWh/m3 over a period of 2 hours. Because this reactor will be dealing with low concentrations, the upper bound was assumed, leading to a power consumption of 170kW for a reactor of the required size. Common cathode materials are carbon felt or graphite, and a common anode material is platinum.
When filling the reactor, the iron concentration needs to be increased to 10-4M and the pH decreased to 3 by the addition of 0.12kg FeSO4 and 0.17gal 37% HCl to reach optimal operating conditions, and 0.08kg NaOH is used to neutralize the system before evacuating the reactor tank. These feeds are very inexpensive. Heat effects are assumed to be small due to the low concentrations involved. Any increases in temperature will be offset by cooling towards ambient conditions through piping and other units. Sample calculations for sizing and costing can be found in Appendix G.
Granulated Carbon Absorption
Given the complexity of reacting mechanisms of the Fenton reaction, the true output of the reactor cannot be precisely determined. Instead, the components most likely contained in the effluent are proposed to allow for an approximate end result. For the purpose of this study, acrylic acid, propionic acid, acetic acid, 1,2-benzoquinone, were the selected end products from the Electro-Fenton reaction and all of the aforementioned components will be effectively absorbed into a granulated activated carbon (GAC) adsorption bed.
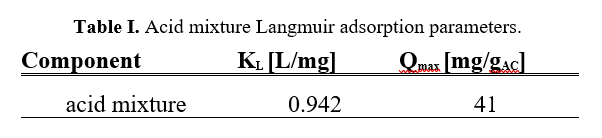
To approximate the adsorption model, the process was assumed to follow mono-layer deposition onto the surface of the active carbon. Such approximation requires Langmuir-type equilibrium isotherms to be specified for each component. Given the challenge of finding equilibrium data on the exact same components, isotherm parameters for similar substances were researched to help as a second modeling approximation.
The equilibrium parameters for the acid mixture will be modeled after a mixture of acetic, propionic, and butyric acid. Whereas for 1,2-benzoquinone and the remaining acrylamide, no modeling will be performed given that the outlet concentrations after oxidation by the Electro-Fenton reactor are in the single digit mg/L, making negligible their deposition into the adsorbent. Table I below shows the equilibrium isotherm parameters reported at 303K (30°C).
The parameters correspond to a Langmuir adsorption model of the form,
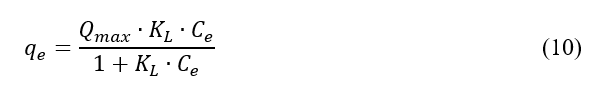
where qe [mg/gAC] is the saturation of activated carbon (loading) in equilibrium with the concentration Ce [mg/L]. Qmax [mg/gAC] determines the maximum loading for that component. The mass balance of an adsorption bed will require rigorous experimentation with a physical column and developed breakthrough curves, which need to be determined to fully evaluate the performance of adsorption of contaminants. To simplify the adsorption process, the following assumptions are made: mass transfer limitations are ignored due to the dilute nature of the stream; the entire cross-sectional area of the bed is fully wetted; adsorption occurs in a plug-flow fashion where slices of bed are first saturated, effectively reducing stream contaminant concentration; the bed is fully hydrophobic; and the contaminants are adsorbed instantly into the bed slice. Building upon these simplifications the required bed mass to ensure the removal of contaminants can be determined.
Assuming the bed is divided into 1-gram slices of GAC, the amount of contaminant removed from the stream can be calculated with the isotherm (eq. 10). A new stream concentration is determined for the next bed slice, effectively creating a concentration reduction as there are more available slices. This methodology accounts for the decreased adsorption efficiency for the subsequent slices.
After the reactor, the stream is pressurized to 259 kPa, in order to overcome the pressure drop from both charcoal adsorption and ion exchange columns, the centrifugal pump requires 28 kW to achieve the specified pressure. The acidic mixture effluent enters the bed at 0.67 mg/L. Ideally, the output effluent concentration is at or below 0.01 mg/L. Figure 4 below shows the concentration reduction of the process stream as a function of bed mass.
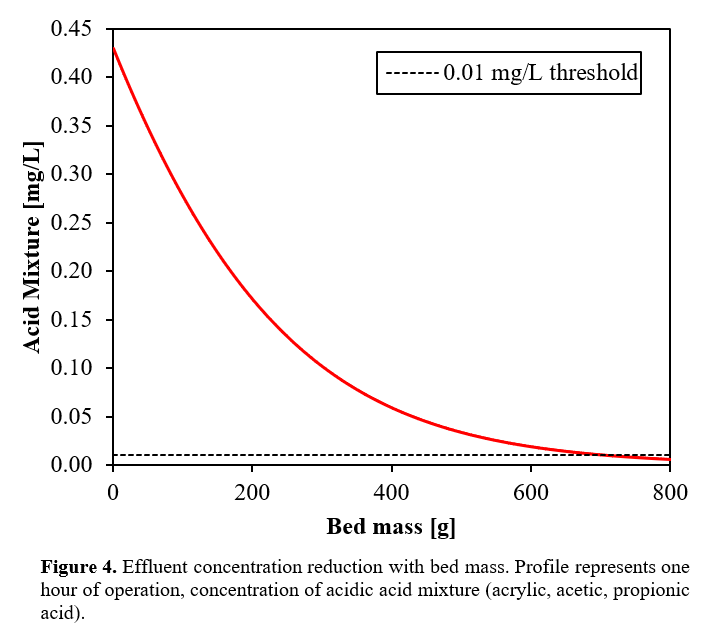
Overall, the process requires 0.72 kg of GAC per hour of operation to ensure the required removal of acid mixture. The total bed mass required amounts to 4.3 tonne/year. Detailed calculation methodology is presented in Appendix C.
The required activated carbon specified at an apparent density of 966 kg/m3 with an average porosity of 0.5 and average particle diameter of 1 mm, produces a pressure drop of 8 kPa across a 7.5m long adsorption bed. The bed is designed for the adsorbent to be changed twice a year.
Ion Exchange
The final unit in the purification process is an ion exchange column. The purpose of this unit in the process is to reduce ammonia nitrogen concentration in the treated water. Ion exchange columns consist of a packed bed column containing an ion exchange resin. Ions in the liquid process stream are separated via adsorption into the solid resin particles. In this case, the adsorbent resin consists of bentonite clay, and the solute consists of NH4+ ammonium ions. Bentonite also removes any other polar or ionic compounds, such as the small amount of iron catalyst that exits the Fenton reactor.
The ion exchange column was included to treat dissolved ammonia nitrogen. Ion exchange was chosen because of its effectiveness, low material and energetic costs and ease of operation. Other methods considered were reverse osmosis, air stripping and biological treatment. However, they all presented disadvantages which were not compatible with this process, described in Han et. Al. Air stripping required significant energy consumption, which is not in line with the sustainability aspect of this project. Reverse osmosis was significantly more costly. Biological treatment was a continuous process which required a long start-up time. Bentonite clay was selected as the adsorbent because of its high adsorption capacity for ammonium and because it is relatively inexpensive compared to other resins and readily available in the market. Other resins considered were Zeolite clay and Biochar. Zeolite was disregarded because of its lower adsorption capacity in comparison to Bentonite at similar costs, and Biochar was disregarded because of its high cost in comparison to Bentonite.
The process stream enters the column at a pressure of 251 kPa with a dissolved ammonia nitrogen concentration ranging from 7.5-11.5 mg/L. The adsorption capacity of bentonite clay for ammonium is 23 mg/g with an efficiency of 80%.18 The total mass required for bentonite clay is of 25 metric tons per year. A pressure drop of 150 kPa occurs across the packed bed, and the driving force to overcome this pressure drop is created by Pump 2 before the Granulated Activated Carbon bed. The final output is 6,630 kg/hr of treated water at atmospheric pressure and a dissolved ammonia nitrogen concentration of 0.5 mg/L. The outlet water stream meets the overall specifications as defined in Appendix B, with an overall recovery of 90%. Calculations can be seen in Appendix D.
And the report goes on and on, you get the idea